Item Overruns Dashboard: How to View, Interpret, and Use Your Data
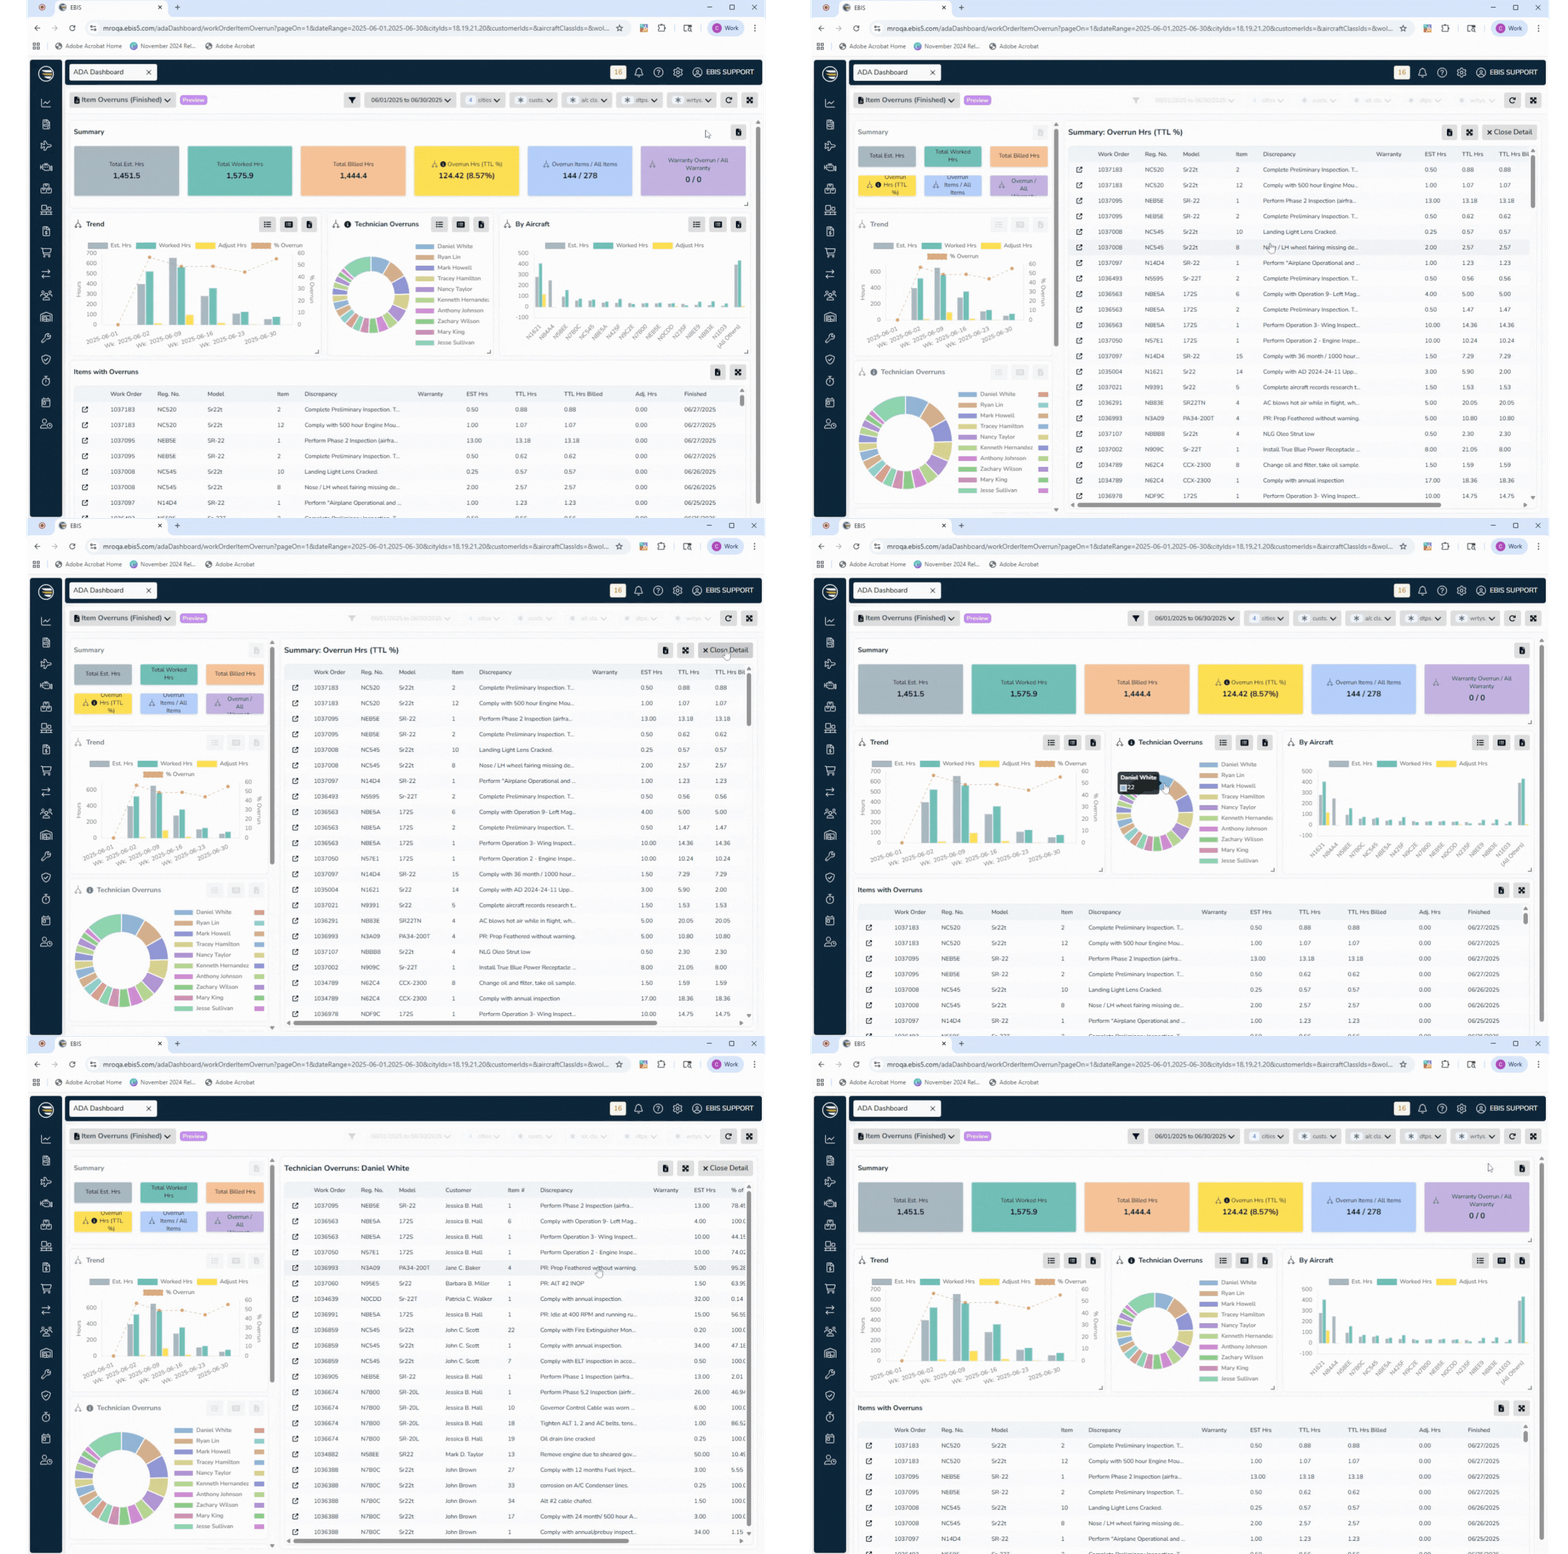
See where actual labor hours exceeded the original estimates on completed work order items.
Overview
The Item Overruns (Finished) Dashboard in EBIS shows where actual labor hours exceeded the original estimates on completed work order (WO) items. This visibility helps you:
- Improve future estimation accuracy.
- Catch jobs that are trending over budget.
- Strengthen billing accuracy and transparency.
- Identify recurring efficiency issues.
You can view data by aircraft, technician, time period, or individual work order item.
Jump To:
Note: You must be an Advanced Access User (AAU) to use the ADA Dashboard module. Users also must have permissions activated. To activate this module and permissions in your EBIS account, see the Security & Permissions section below.
Key Metrics
Estimated Hours
- Definition: Hours originally planned for each WO item.
- Source: Entered in the WO line item Estimated Hours field during work order creation/scheduling.
Hours Worked
- Definition: Total hours recorded by all technicians on a WO item.
- Source: Technician service time entries (clocked or manual overrides).
Adjusted Hours
- Definition: Manual corrections made by supervisors/admins after completion.
- Purpose: Correct errors, capture non-billable activities, or make other changes.
- Source: Service adjustment hours logged to a WO line item using the "EBIS Item Adjustment" user.
- Display:
- On Charts & Graphs: Always shown as a positive number in reports, even if hours were subtracted. Makes it easier to identify adjustments.
- On Detailed Reports/Drill Downs: Negative adjustment values in the report columns means hours were subtracted; positive means added.
How Overruns Are Calculated
Overrun:
- Definition: Any WO item where actual Hours Worked is greater than Estimated Hours.
Overrun Hours
- Definition:
Hours Worked – Estimated Hours(if greater than zero). - Purpose: Shows how much extra time was spent beyond the estimate.
Percent Overrun
- Formula:
(Hours Worked – Estimated Hours) ÷ Estimated Hours × 100 - Purpose: Indicates by what percentage actual hours exceeded the estimate.
Overrun Count
- Definition: The number of WO items in a period that exceeded their estimates.
Requirements to Make the Dashboard Work
To ensure the Item Overrun Dashboard displays accurate data:
- Work Order line items must include Estimated Hours
- Enter estimates when creating WO items. Items without an estimate will not appear in the dashboard.
- Technician Time Entries must be logged
- Hours Worked comes directly from technician service timers or manual entries.
- Adjustments must be logged correctly
- Users must set the final billable hours on the WO line item using the TTL Hrs field. This will create an "EBIS Item Adjustment" service timer record and will display the adjusted hours on the dashboard and reports.
- Permissions Required
- Users need the correct dashboard permissions (see Security and Permissions section below).
Important Notes:
- This report only shows WO line items in a Completed status.
- Only items with both an estimate and hours worked are included in reports.
- Adjusted Hours are always displayed on graphs and charts as positive numbers for clarity.
- All hours are secured and filtered by user permissions.
How to Use the Dashboard Reports
By Aircraft
- Identify which aircraft have the most or largest overruns.
- Useful for tracking high-maintenance or problematic assets.
Technician Overruns
- See how much each technician contributed to overruns.
- Identify training or process improvement opportunities.
Trends (Weekly/Monthly)
- Monitor whether overruns are improving or worsening over time.
- Spot seasonal or workload-related issues.
Items with Overruns
- View individual WO items where hours exceeded estimates.
- Investigate root causes for persistent overruns.
Exporting Data
All widgets in the Item Overrun Dashboard support .xlsx exports. You can:
- Export Summary View – high-level totals and averages.
- Export Detailed Data – all underlying records that make up the summary.
- Drill into a tile and export the detailed results for that selection.
Exports respect your filters (date range, aircraft, technicians, etc.).
Security & Permissions
To view this dashboard, a user must be an Advanced Access User and have these permissions turned on. To edit these permissions, go to Config > User Profiles > (select a profile) > Access Levels >:
ADA Dashboard tab:
- View (mandatory)
- Export (optional, but required to export to CSV)
- View Revenue Info (optional)
Work Orders tab:
- View (mandatory)
- Tech Activity: View Summary (mandatory)
- Tech Activity: View Detail (optional, but required to drill into records)
If a user lacks these permissions, they will not see or access the dashboard.
Common Questions This Dashboard Answers
- How often do our technicians exceed original estimates?
- Which aircraft or customers experience the most overruns?
- Are certain technicians consistently under- or over-estimating jobs?
- Is overrun performance improving or worsening over time?
- How much extra labor is being absorbed vs. billed?

